A Bad Sampling Example
Shere Hite’s book Women and Love: A Cultural Revolution in Progress (1987) had a number of widely quoted results:
- 84% of women are “not satisfied emotionally with their relationships” (p. 804).
- 70% of all women “married five or more years are having sex outside of their marriages” (p. 856).
- 95% of women “report forms of emotional and psychological harassment from men with whom they are in love relationships” (p. 810).
- 84% of women report forms of condescension from the men in their love relationships (p. 809).
The book was widely criticized in newspaper and magazine articles throughout the United States. The Time magazine cover story “Back Off, Buddy” (October 12, 1987) called the conclusions of Hite’s study “dubious” and “of limited value.”
A Bad Sampling Example (cont’d)
- The sample was self-selected—recipients of questionnaires decided whether they would be in the sample or not. Hite mailed 100,000 questionnaires; only 4.5% were returned.
- Questionnaires were mailed to organizations such as professional women’s groups, counseling centers, church societies, and senior citizens’ centers—groups whose viewpoints may differ from other women in the United States.
- The survey has 127 essay questions, most with several parts. Who will tend to return such a survey?
- Many questions are vague (e.g., “love”), making percentages hard to interpret.
- Many questions are leading, suggesting to the respondent which response to give.
Type of Probability Sampling
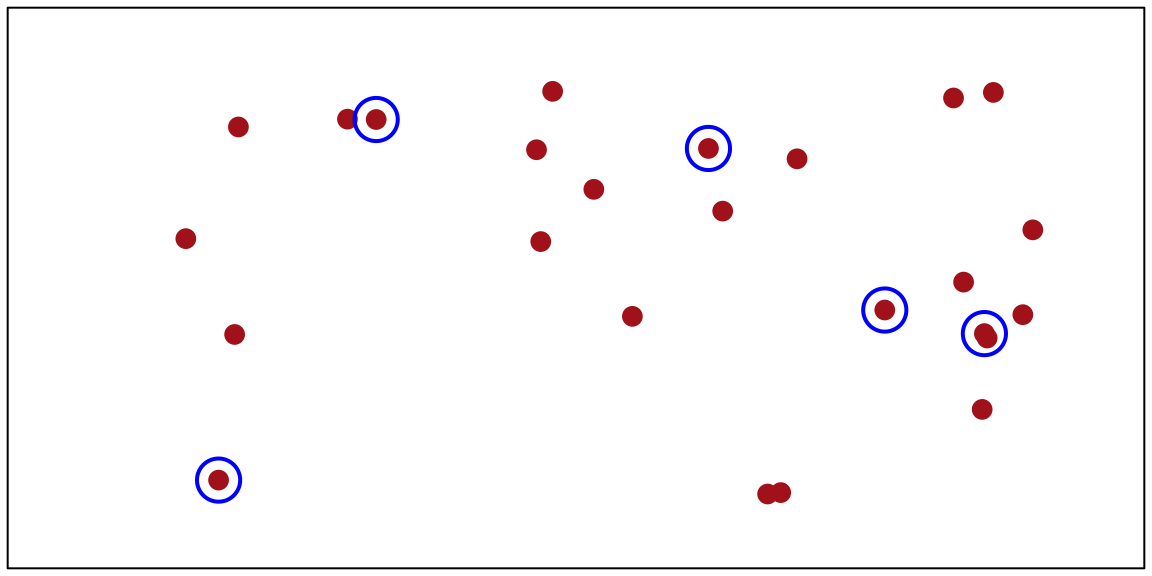
A simple random sample (SRS) is the simplest form of probability sample. An SRS of size n is taken when every possible subset of n units in the population has the same chance of being the sample.
![]()
Figure 1
Stratified Random Sampling
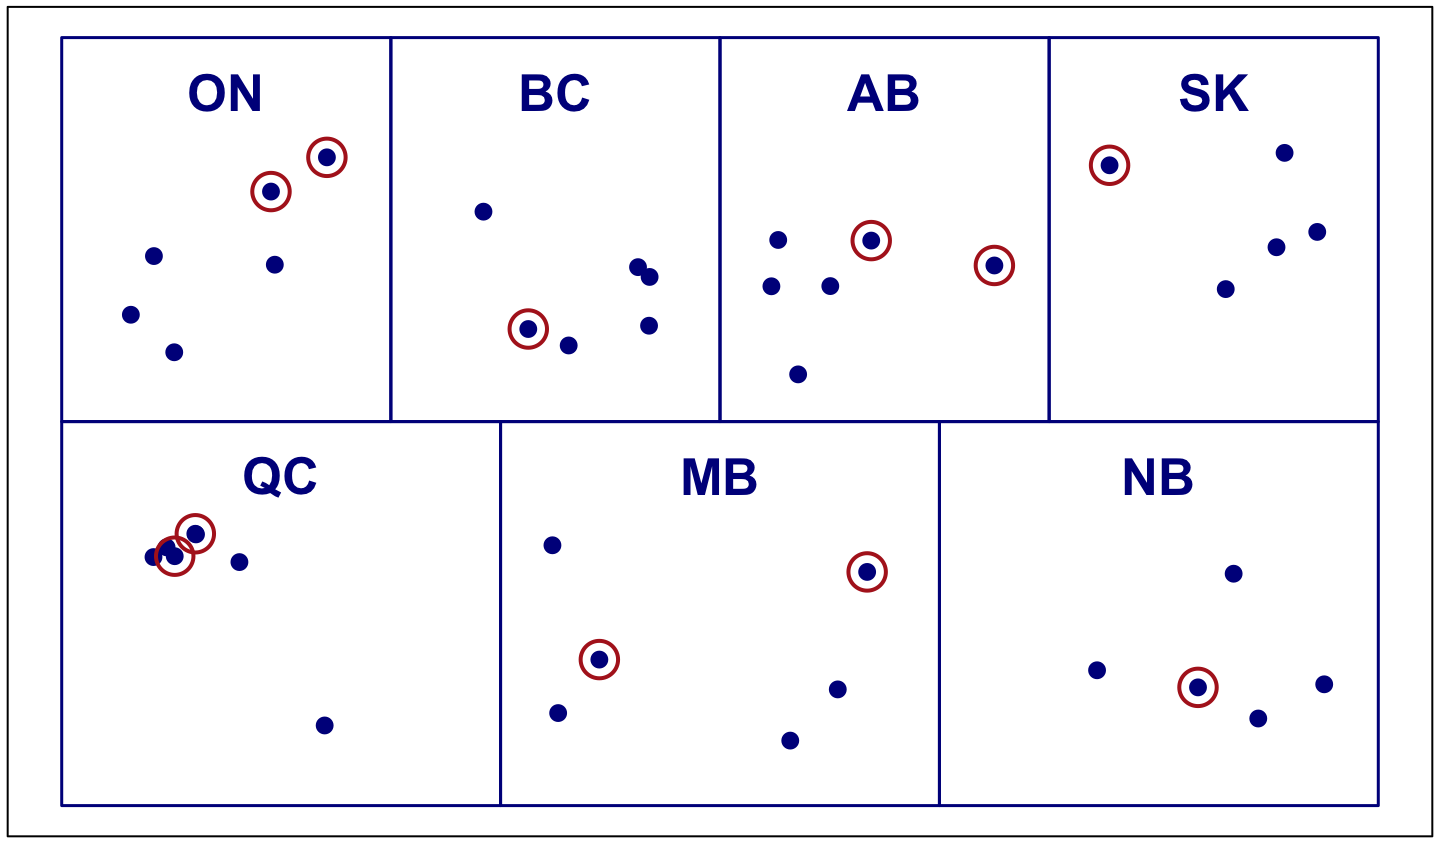
In a stratified random sample, the population is divided into subgroups called strata. An SRS is selected independently from each stratum. Strata are often subgroups of interest—regions of a country, terrain types, or firm sizes. Stratification often increases precision because elements within a stratum tend to be more similar than randomly selected elements from the whole population.
![]()
Figure 2
Cluster Sampling
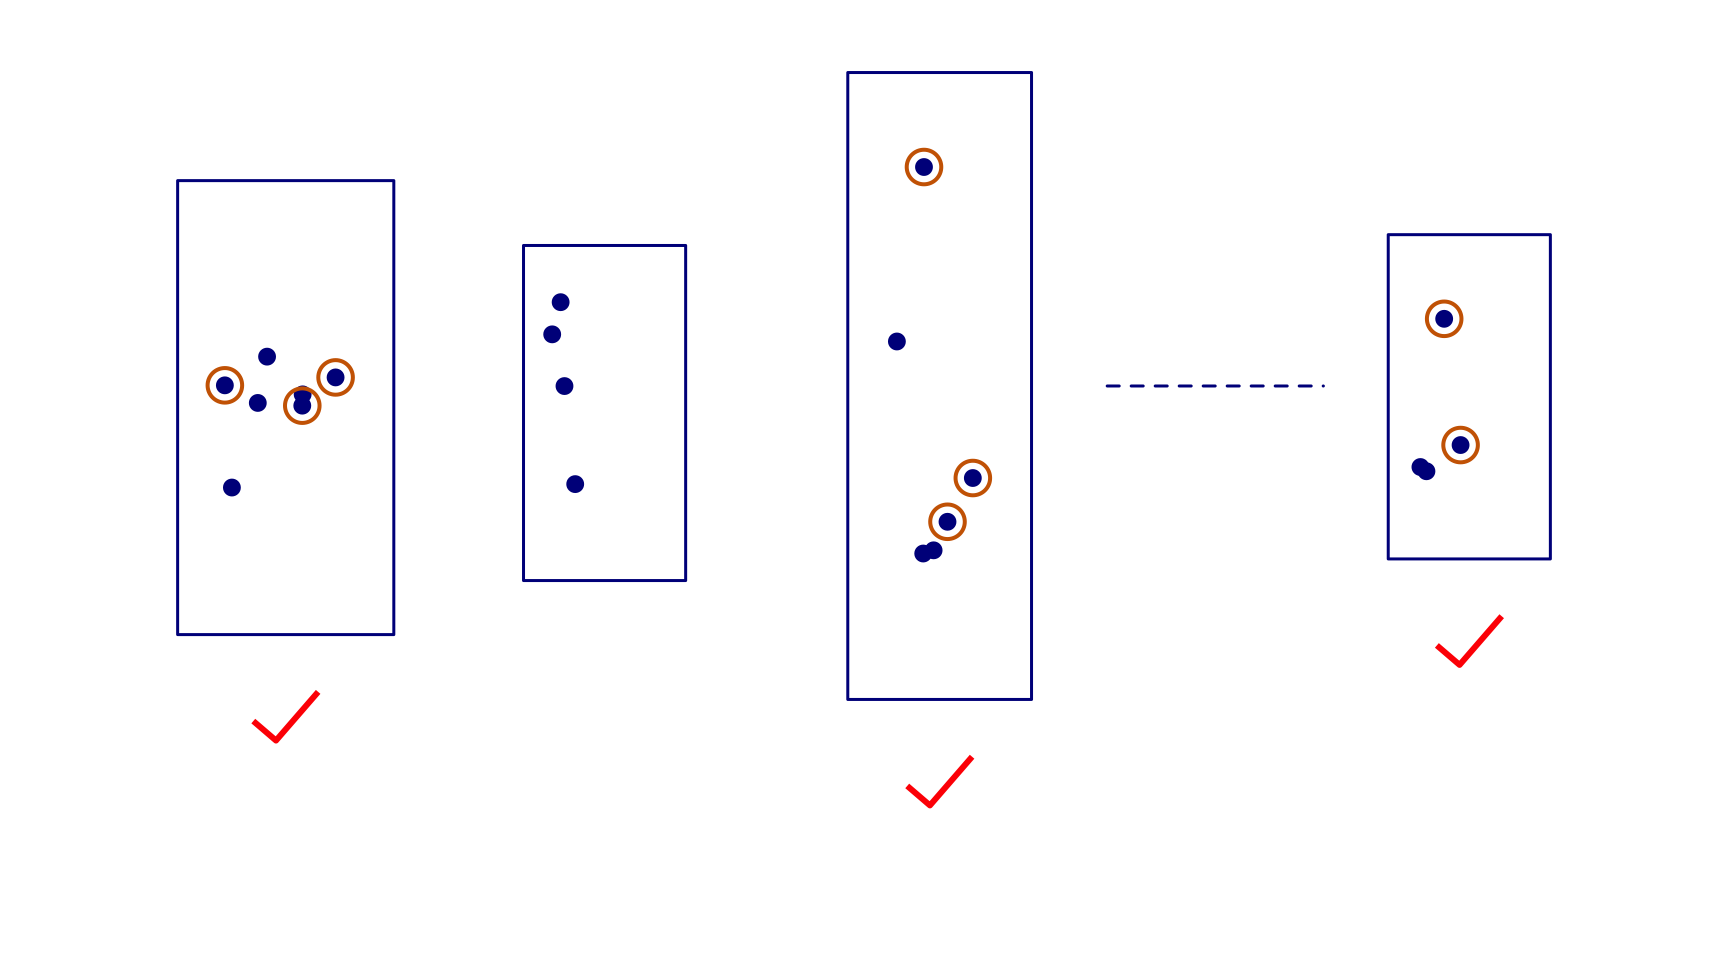
In a cluster sample, observation units are aggregated into larger sampling units called clusters.
Example: to survey Lutheran church members in Minneapolis without a list of all members, take an SRS of churches (clusters), then subsample members within each selected church (observation units). This is convenient, but members of the same church may be more similar to each other than a random sample of Lutherans, so a cluster sample may provide less information than an SRS of the same size.
![]()
Figure 3
Elements of Sampling Problems
Reading suggestions:
- Lohr, Ch 1
- Scheaffer et al., Ch 2
Basic Definitions
Observation unit An object on which a measurement is taken; also called an element. In human population studies, observation units are often individuals.
Target population The complete collection of observations we want to study. Defining the target population is often difficult—for example, should a political poll target all eligible adults, all registered voters, or all who voted last election?
Sample A subset of a population.
Basic Definitions (cont’d)
Sampled population The collection of all possible observation units that might have been chosen in a sample—the population from which the sample was actually taken.
Sampling unit A unit that can be selected for a sample. We may want to study individuals but lack a list of them; instead, households serve as sampling units while individuals remain the observation units.
Sampling frame A list, map, or other specification of sampling units in the population from which a sample may be selected (e.g., a list of telephone numbers, street addresses, or farms).
Target vs. Sampled Population
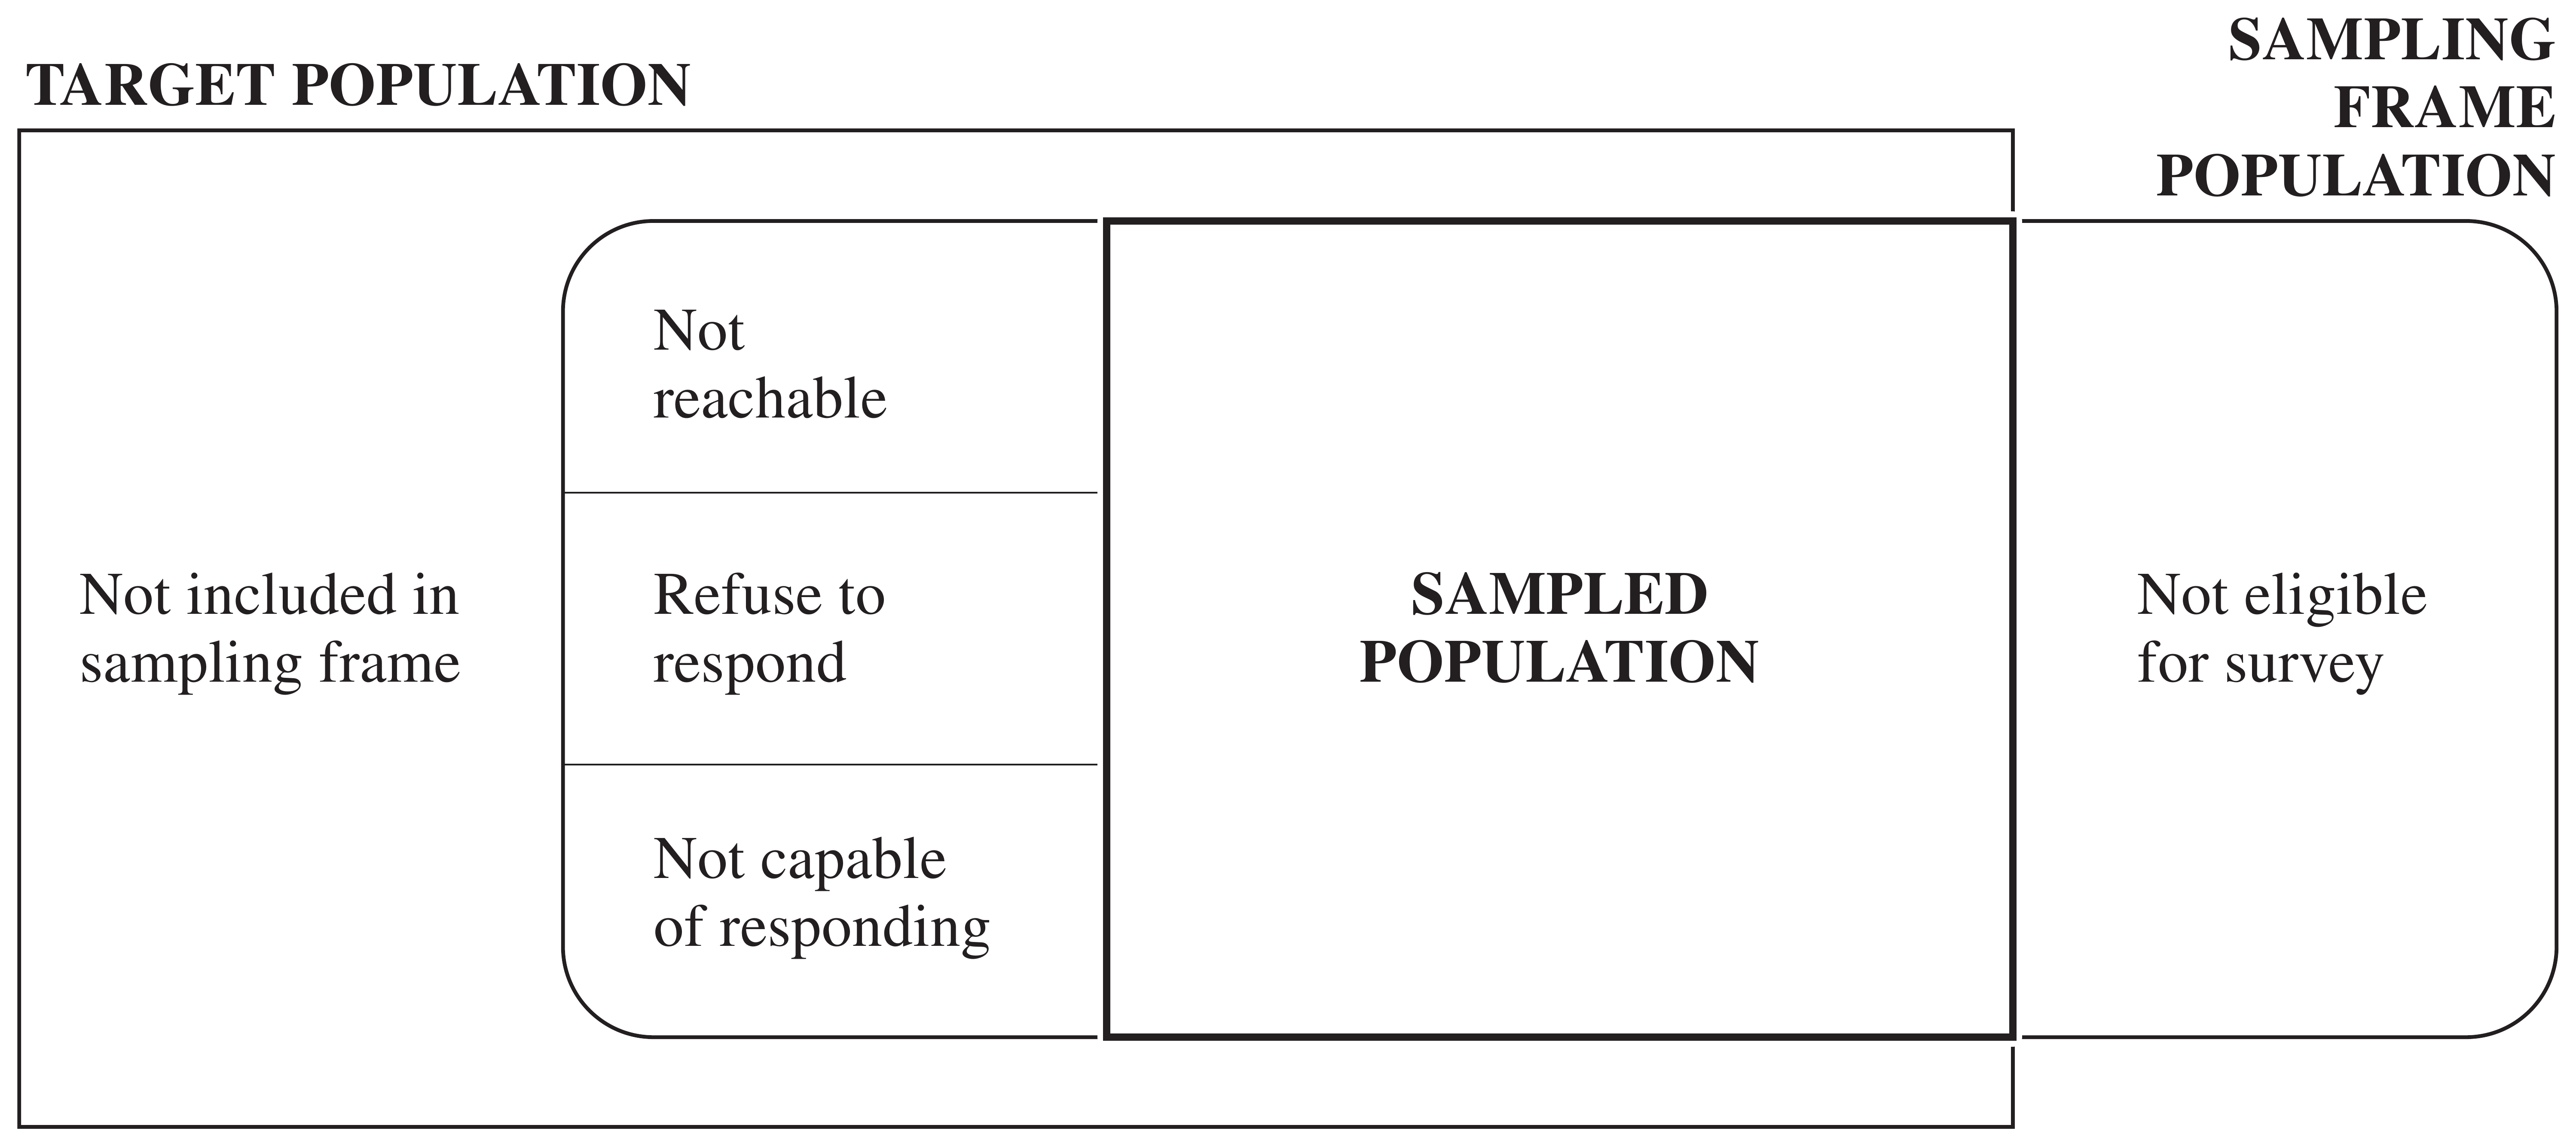
In an ideal survey, the sampled population equals the target population, but this ideal is rarely met. Not all persons in the target population are in the sampling frame, and some in the frame are not reachable, refuse to respond, or are not capable of responding.
![]()
In the Hite (1987) study: the element was an individual woman, the target population was all adult U.S. women, but the sampled population was women belonging to women’s organizations who would return the questionnaire.
Selection Bias
Selection bias occurs when part of the target population is not in the sampled population, or more generally, when population units are sampled at a different rate than intended.
A sample of convenience is often biased, since units that are easiest to select or most likely to respond are usually not representative of harder-to-select or nonresponding units.
Selection Bias: Examples
- A convenience sample of adolescents used to study communication about AIDS likely overestimated parent-teen communication, since adolescents willing to talk to investigators are also more likely to talk to other authority figures.
- Misspecifying the target population: 1994 Arizona gubernatorial primary polls predicted Eddie Basha would trail by 9+ points; he won 37% of the vote. The polls targeted past primary voters, missing new rural voters who supported Basha.
Selection Bias: Coverage Problems
Undercoverage — failing to include all of the target population in the sampling frame. The U.S. Behavioral Risk Factor Surveillance System survey (telephone-based) misses households without phones, and historically missed cell-only households; coverage varies by region and income.
Overcoverage — including units in the sampling frame that are not in the target population, e.g., interviewers including under-18 respondents in an adults-only radio survey.
Selection Bias: Nonresponse
Failing to obtain responses from all of the chosen sample. Nonresponse distorts survey results even when other sources of selection bias are minimized.
Nonrespondents often differ critically from respondents, but the extent of that difference is usually unknown. Some published surveys have response rates as low as 10%—it is difficult to generalize results when 90% of the sample cannot be reached or refuses to participate.